infographic tools for teachers and students
These are just a few of the many tools that are used to create infographics. They are generally regarded as being some of the most user-friendly graphics generators for teachers and students. However, new tools are emerging almost daily. Other tools such as Wordle and Tagxedo are useful for creating picture clouds from data that can be inserted into an infographic.
These are currently the four easiest (and free) infographic generators for teachers and students to use.
Smore and Easel.ly create infographics without interactive data.
If you'd like your students to insert data as an interactive chart or map, use Piktochart or Infogr.am.
Smore and Easel.ly create infographics without interactive data.
If you'd like your students to insert data as an interactive chart or map, use Piktochart or Infogr.am.

smore tutorial (6 min.)
This infographic tool is the most simple to use (drag 'n drop). The layout is strictly vertical - reads top to bottom - which is a good choice for a first infographic lesson or for lessons which must be completed in a short period of time. |

easel.ly tutorial (5 1/2 min.)
Easy to use, lots of features. Many templates to choose from. The Easel.ly layout has more design and layout choices than Smore. |

piktochart tutorial (3 1/2 min.)
Easy to use, lots of features. Users can create an infographic, a chart, a banner, or a presentation. Piktochart has a very easy way to create and add an interactive element. Just click the Tools icon in the editor to choose a chart or map; add your data and drag it onto the page. |

infogr.am tutorial (7 min.)
Infogram is a little more complex. Use this tool if you wish to use data to add an interactive chart to your infographic. |
Create an Infographic Using PowerpointThis link provides step-by-step directions for creating an infographic using PowerPoint and Pixlr
|

This popular educational tool makes it easy
to create infographics. |
infographic APPS (Most free infographic apps are very basic, with limited functionality)

Grafio Lite iPad App (free) |

|
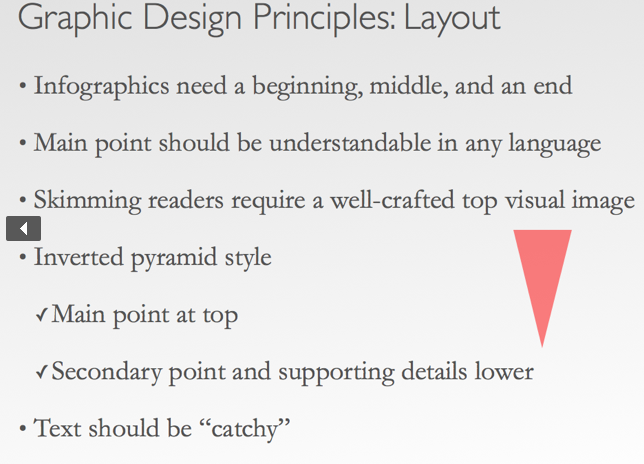
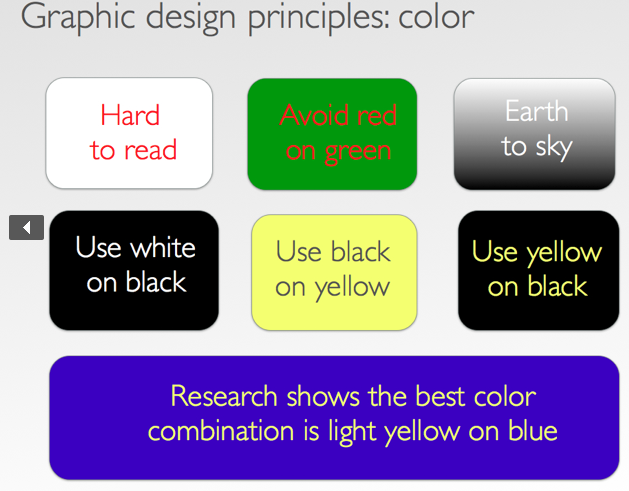
Infographic Design and Layout (courtesy of Kathy Schrock)
|
|
useful infographic tools
Find the Data"unbiased, data-drivencomparisons"
Information from three sources: Public databases, primary sources (manufacturer websites) and expert sources. |
The Noun ProjectThe Noun Project is making clip art icons for every known noun, making it a perfect place to look for the images needed for a precise infographic. It can take a lot of time to find a perfect image of a cracked cell phone or a specific kind of dog, and the Noun Project makes that a little easier. Registration is free.
|
CIA World FactbookThe World Factbook provides information on the history, people, government, economy, geography, communications, transportation, military, and transnational issues for 267 world entities. The Reference tab includes: maps of the major world regions, as well as Flags of the World, a Physical Map of the World, a Political Map of the World, a World Oceans map, and a Standard Time Zones of the World map.
|
gapminderLots of world data in excel form to easily import into an Infographic generator.
online chart toolWith Onlinecharttool.com, you can design and share your own charts online and for free.
|
Google ChartsCreate interactive charts by embedding code in your page. This Google Developers site shows you how. (This is for users who know a little about code.)
Clipping Magic
Use clipping magic to remove unwanted areas around an image, such as white space
|
Icon ArchiveOver 400,000 free icons to use in your infographic.
IconfinderOver 358,000 icons to use in your Infographic.
|
wolfram alphaWolfram Alpha is an online service that answers factual queries directly by computing the answer from externally sourced "curated data".
|
learning more
Linn McDonald | Library Media Specialist | Bloomington Jr. High School, Bloomington, IL | [email protected]
